
You’re measuring water. But are
you measuring the right thing?
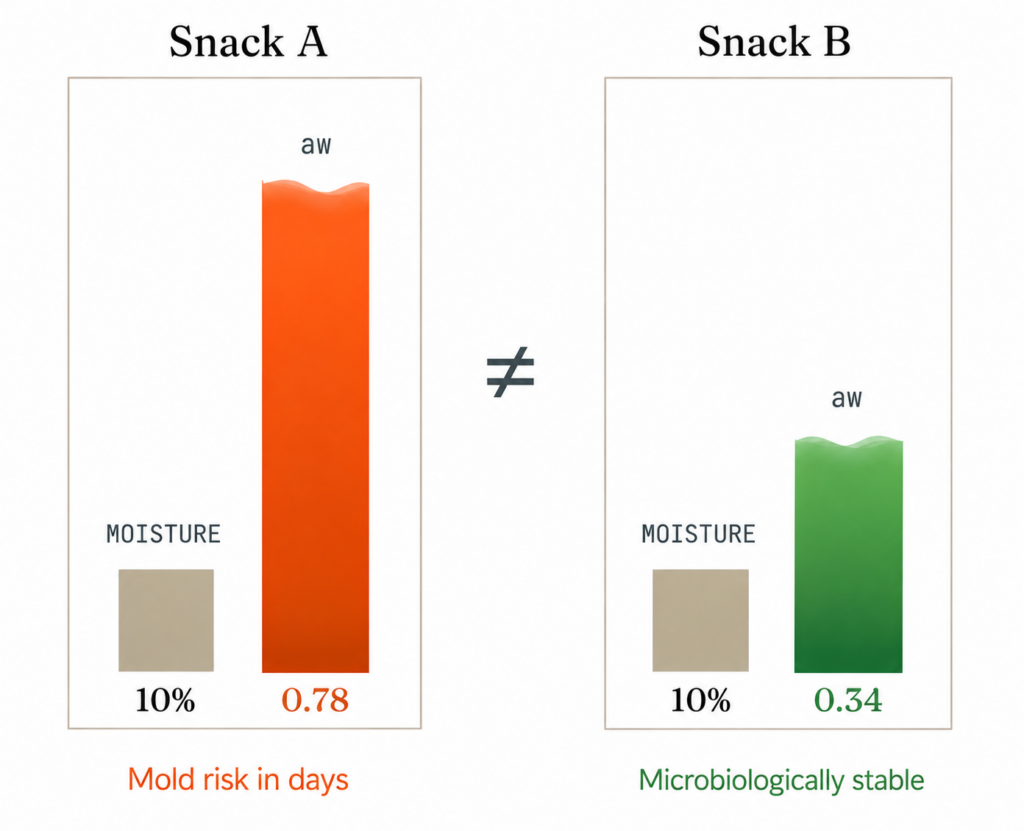
Two products can show identical moisture content — while one stays stable and the other fails. Water activity reveals what the water can actually do.
Moisture content is not
wrong. It is solving a
different problem.
Moisture content is useful for recipe control or yield for example. But it was not designed to predict microbial safety, chemical degradation or texture failure.
|
Question |
Moisture Content |
Water Activity |
|---|---|---|
|
How much water is present? |
– |
|
|
Recipe consistency, yield and weight control |
– |
|
|
Can microorganisms grow? |
– |
|
|
Will shelf life hold? |
– |
|
|
Will powders cake or snacks lose crunch? |
– |
|
|
Will moisture migrate between components? |
– |
Same moisture number. Completely different stability story.
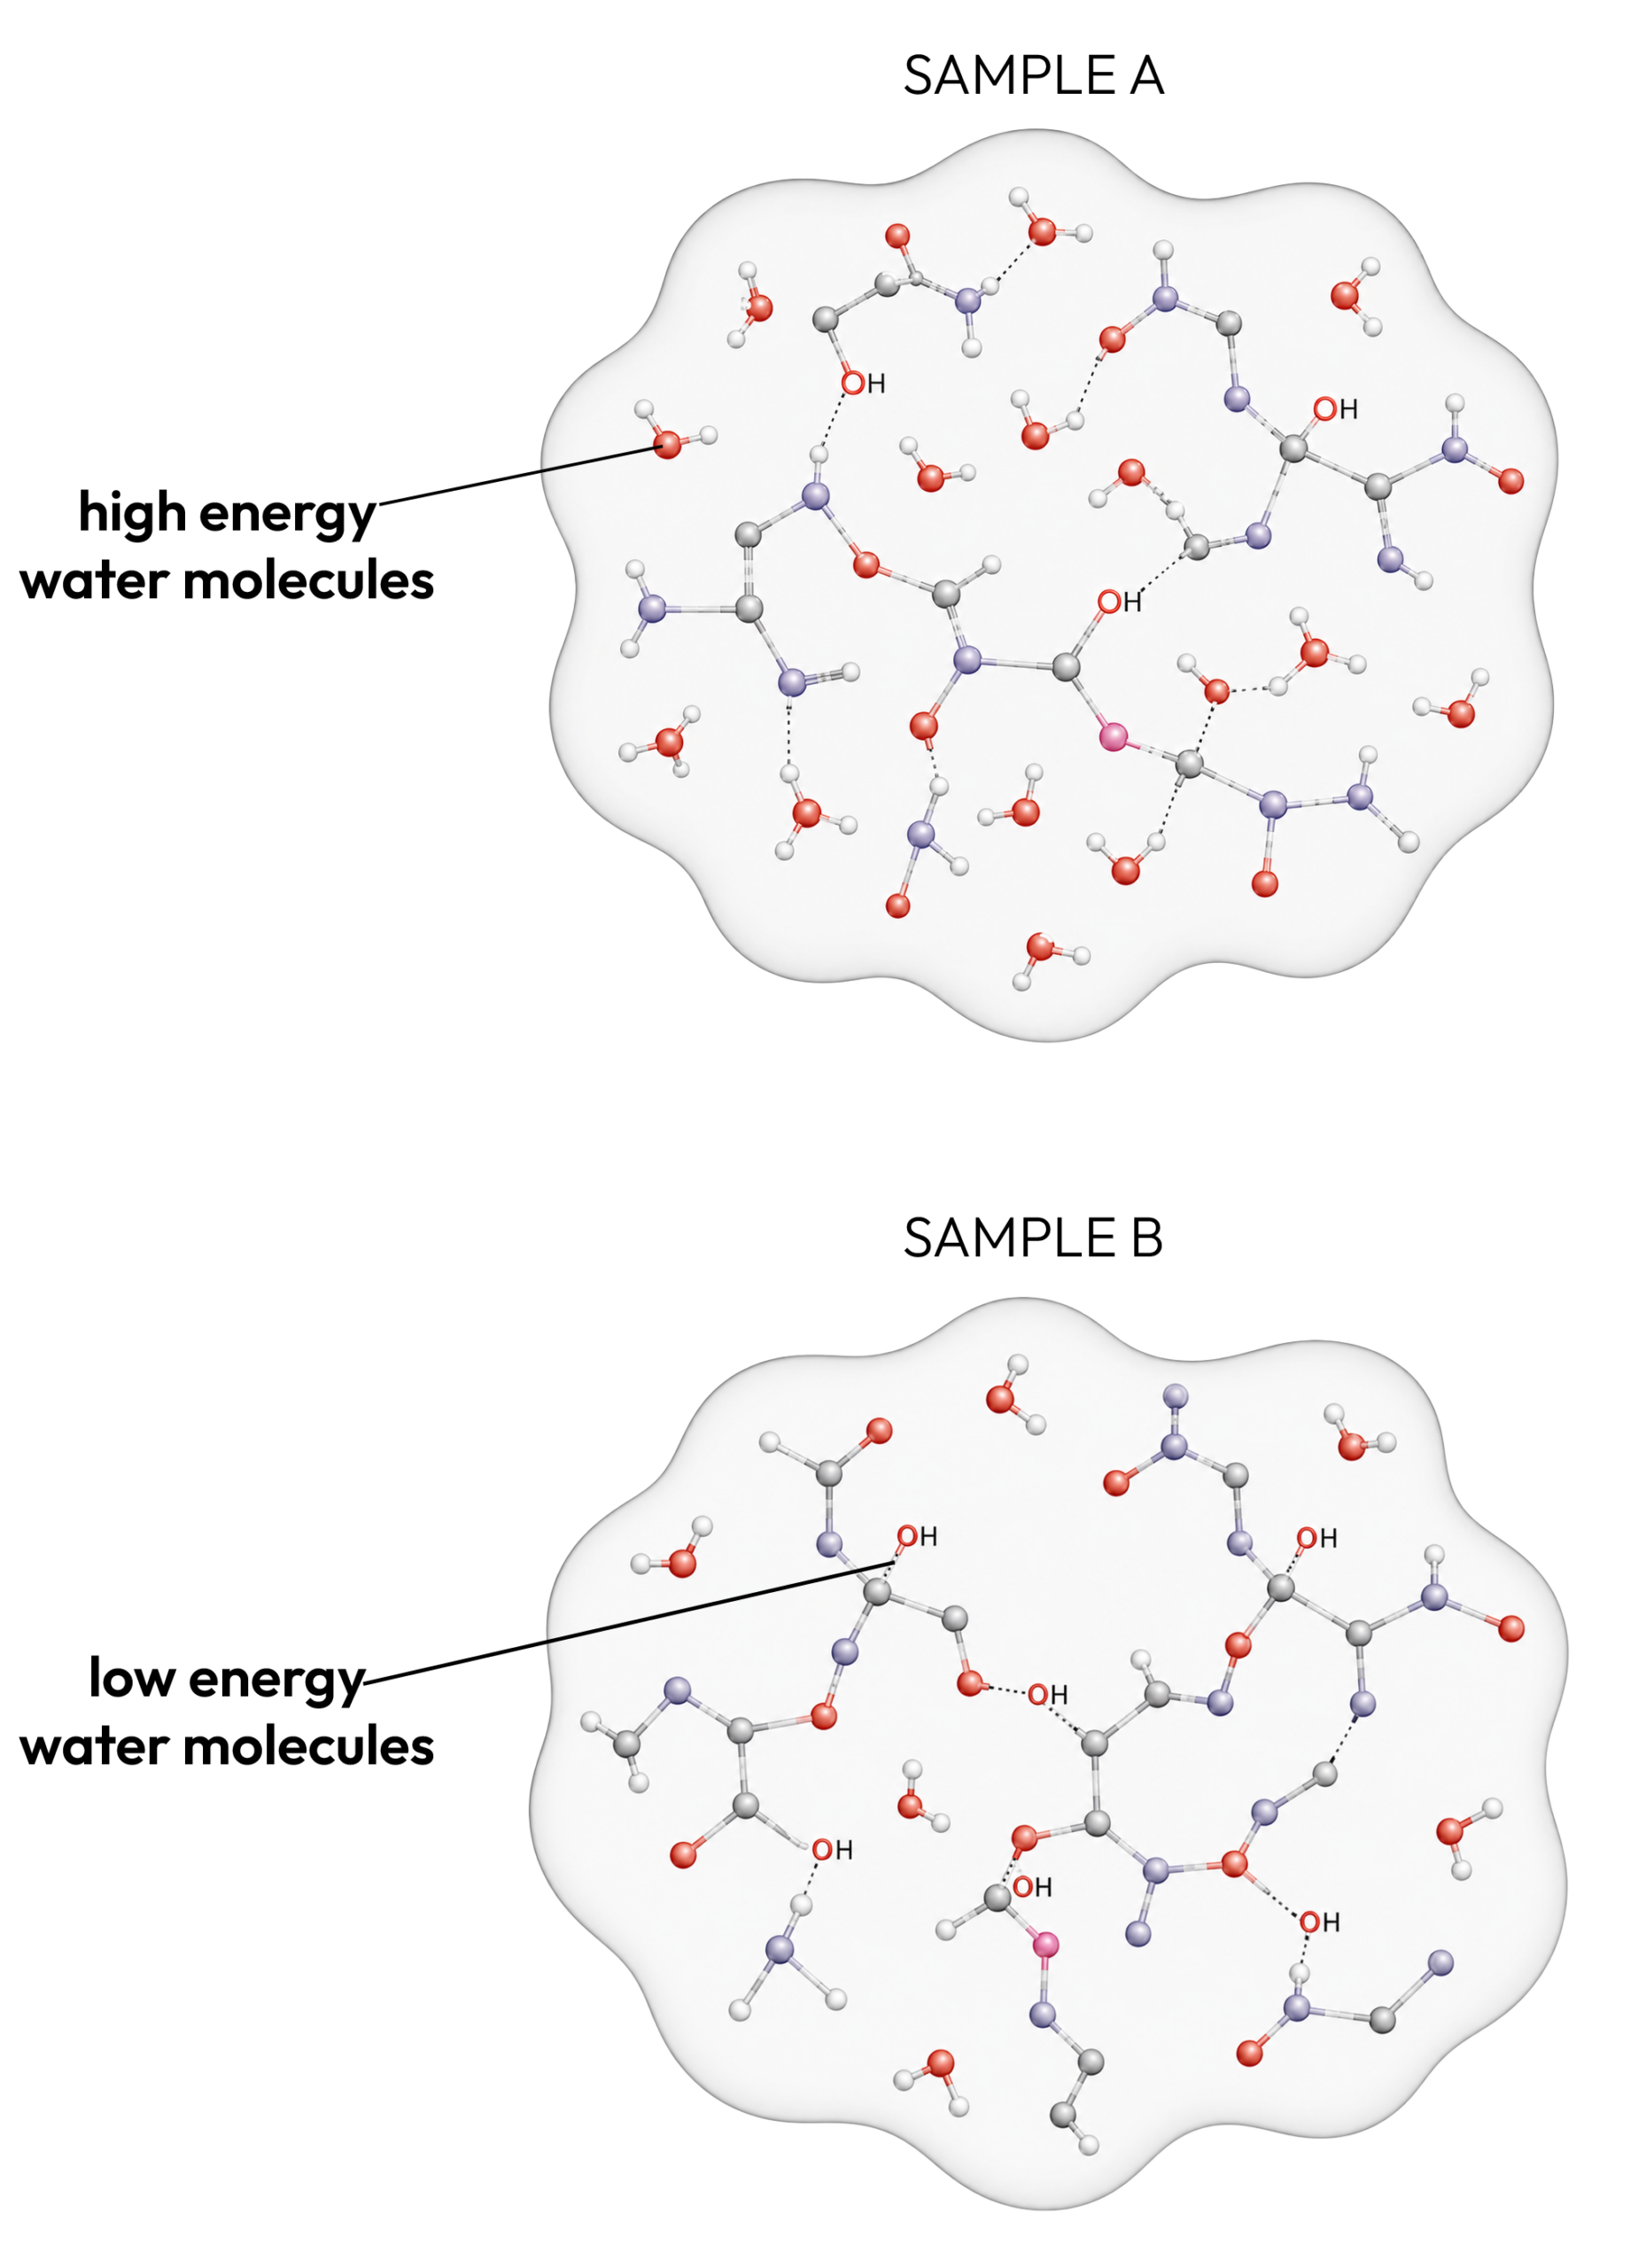
Moisture content describes the total amount of water present in a material. It includes water held by general binding interactions, adsorption, capillary effects, or retention within the product structure for example.
Water activity reflects the chemical potential energy of water in a material. In simple terms, it indicates how „available“ the water is for microbial growth, chemical reactions, and physical changes.
A sugar-rich product and a starch-based product can have the same moisture content while having completely different water activity values.
Water activity reveals what moisture content hides.
For product stability, the important question is not only how much water is present. It is whether that water is available to move, react, evaporate or support microbial growth.
Risks moisture content
cannot reliably predict
A product can remain within its moisture specification while its actual stability risk increases. This can lead to customer complaints, costly recalls, and damage to brand reputation.
Microbial growth
Microorganisms do not respond to total water. They require available water. Water activity determines whether bacteria, yeasts and molds can grow.
Reduce safety risks
Chemical degradation
Flavor loss, oxidation, color change or API degradation in pharmaceuticals depend on water availability, not simply total moisture.
Protect product quality and value
Texture failure
Caking, clumping, softness, loss of crunch and moisture migration are driven by water activity differences.
Improve consistency
Want to see the difference
in practice?
Stop asking only how much water is present
Start measuring what that water can do. Discover how water activity measurement can improve product safety, stability and shelf life.
SELF–CECK
Six signs you are measuring
the wrong parameter:
WHY NOVASINA
See what moisture content is hiding.
Novasina water activity instruments help manufacturers understand the quality risks, shelf-life limitations and stability drivers that moisture content cannot reveal.
Use water activity to:
Get in touch
Novasina AG
Neuheimstrasse 12
CH-8853 Lachen
Switzerland
Get instant help from our local partners worldwide
We will be happy to advise you.
