

UNDERSTANDING THE SHELF LIFE OF SNACKS AND BAKERY PRODUCTS
The baked snack industry is a constantly growing market valued at $440 billion. These products typically cover a range of textures, colors, and flavors, and it is critical that they remain safe while maintaining their expected texture and sensory properties. One of the most important factors influencing the quality and shelf life of bakery products is water activity. Water activity control can help prevent or minimize various degradative events such as rancidity, microbiological spoilage, staling, or changes in texture due to water migration.
THEORY OF WATER ACTIVITY
Water activity is defined as the Energy status of water in a system and is rooted in the fundamental laws of thermodynamics through Gibb’s free energy equation. It represents the relative chemical potential energy of water as dictated by the surface, colligative, and capillary interactions in a matrix. Practically, it is measured as the partial vapor pressure of water in a headspace that is at equilibrium with the sample, divided by the saturated vapor pressure of water at the same temperature. Water activity is often referred to as the ‘free water’, but since ‘free’ is not scientifically defined and is interpreted differently depending on the context, this is incorrect. Free water gives the connotation of a quantitative measurement, while water activity is a qualitative measurement of the relative chemical potential energy. Rather than a water activity of 0.50 indicating 50% free water, it more correctly indicates that the water in the product has 50% of the energy that pure water would have in the same situation. The lower the water activity then, the less the water in the system behaves like pure water. For baked snacks, water activity is measured by equilibrating the liquid phase water in the sample with the vapor phase water in the headspace of a closed chamber and measuring the Equilibrium Relative Humidity (ERH) in the headspace using a sensor. The relative humidity can be determined using a resistive electrolytic sensor, a chilled mirror sensor, or a capacitive hygroscopic polymer sensor. Instruments from Novasina, like the Labmaster NEO, utilize an electrolytic sensor to determine the ERH inside a sealed chamber containing the sample. Changes in ERH are tracked by changes in the electrical resistance of the electrolyte sensor. The advantage of this approach is that it is very stable and resistant to inaccurate readings due to contamination, a particular weakness of the chilled mirror sensor. The resistive electrolytic sensor can achieve the highest level of accuracy and precision with no maintenance and infrequent calibration. Sampling for water activity testing can be particularly challenging for bakery products because they tend to be too large to fit in the sample cup and are often multi-component. While water activity is an intensive property that provides the energy of the water in a system, moisture content is an extensive property that determines the amount of moisture in a product. Water activity and moisture content, while related, are not the same measurement. Moisture content is typically determined through loss-on-drying as the difference in weight between a wet and dried sample. For baked snacks, moisture content provides a standard of identity and an expected mouth feel but does not determine if the product is microbially safe. Water activity and moisture content are related through the moisture sorption isotherm. Table 1 shows that different baked snacks can have similar water activities, but very different moisture contents. Obviously, the moisture content associated with a safe water activity will be different for each product and as will be demonstrated in the next section, should never be relied on as an indicator of microbial safety.
| Product | Water Activity | Moisture Content |
| Twinkies | 0.795 | 18.9 |
| Chewy Chips Ahoy | 0.647 | 8.60 |
| Oreo Cookie | 0.309 | 1.40 |
| Animal Crackers | 0.303 | 4.60 |
| Potato Chips | 0.182 | 1.30 |
WATER ACTIVITY AND TEXTURE/CRISPINESS
Bakery products are known for their pleasing texture and taste and each product has its own unique organoleptic requirements. The most common mode of failure in baked products is an unexpected change in texture or flavor. For example, a butter biscuit should be crispy, and a cake should show a good mixture of firmness and moisture. Figure 1 shows the water activity range for baked snacks and the expected texture for each region. Changes in water activity will result in changes in texture and each baked product has an optimal water activity range where the texture and taste will be ideal. The key then to prolonging the shelf life of these products is to manufacture them to that ideal water activity and maintain that water activity during storage and transport with effective packaging.
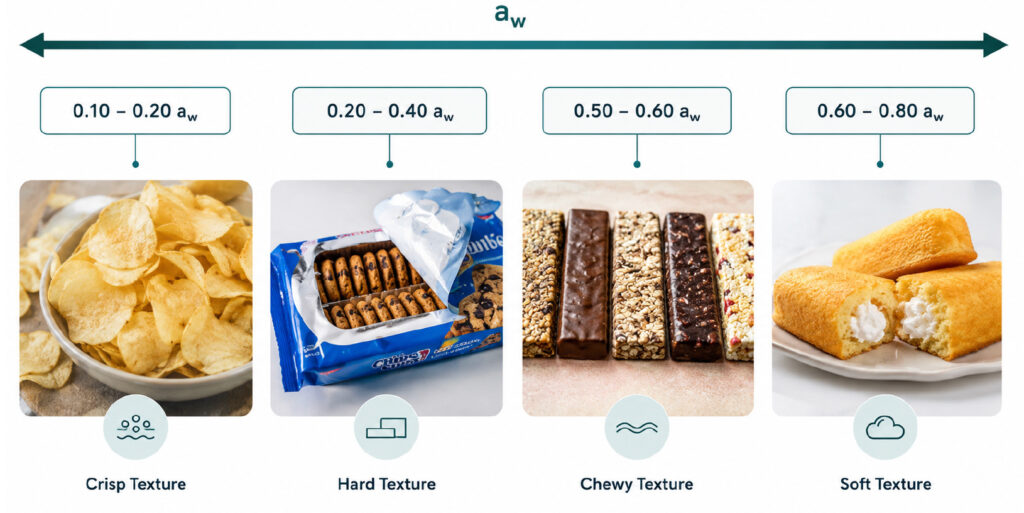
Figure 1. Examples of baked snacks covering the range of water activity and the expected texture profile for each snack
Many bakery products contain multiple components such as a cream filling or an icing covering. For These products, moisture migration between components can lead to undesirable texture changes or even susceptibility to microbial growth. Moisture moves from high water activity to low water activity, so the way to prevent moisture migration and its accompanying consequences is to match the water activity of the components. The icing, cake, and cream filling of a snack cake all need to be manufactured to the same water activity before being combined and then, even if their moisture content is different, there will be no moisture migration between the components
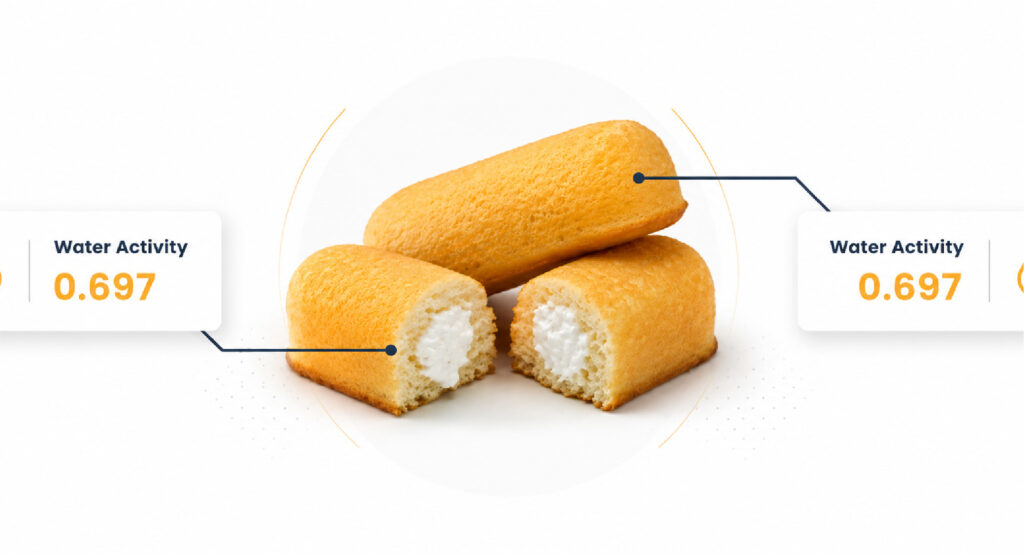
Figure 2. Diagram showing that to avoid moisture migration, the water activity of multi-component snack cakes need to match, regardless of their moisture content.
WATER ACTIVITY AND CHEMICAL STABILITY
The largest category of baked snacks
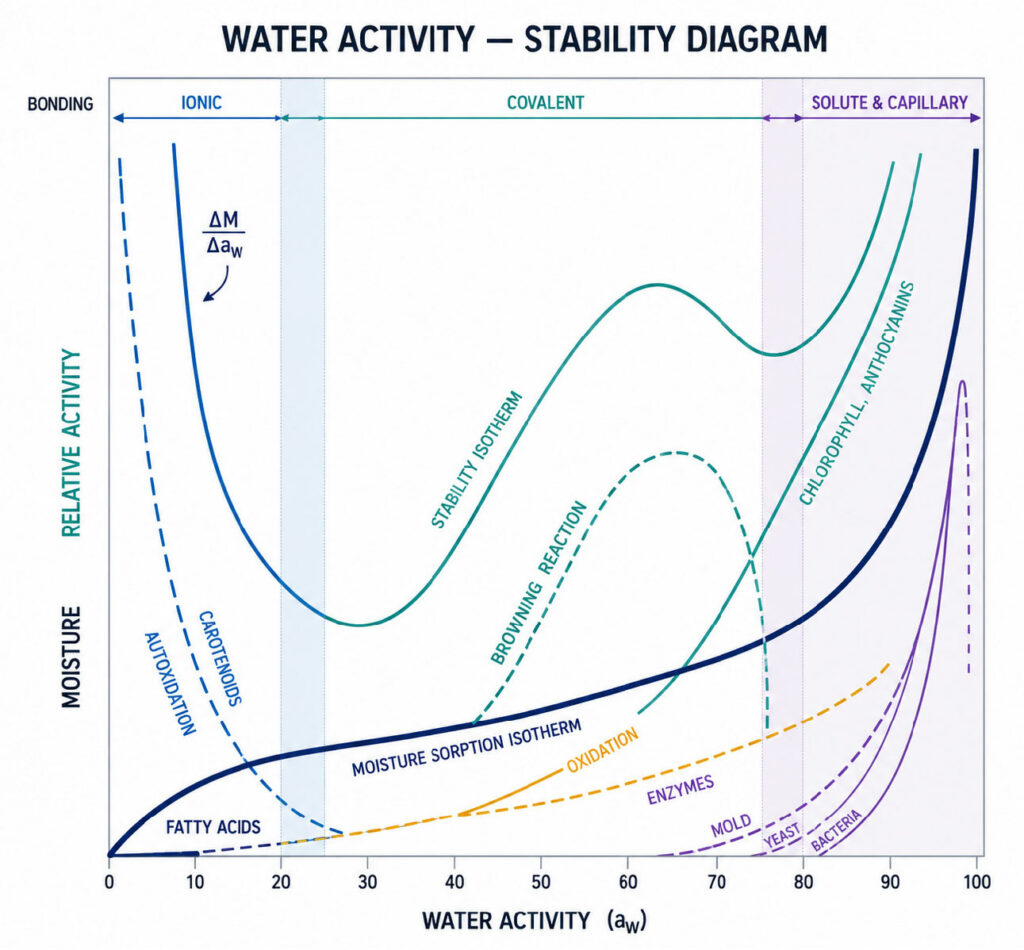
contains products whose water activities are less than 0.70 aw, so microbial spoilage is not the most likely event that will end shelf-life. For products that need to be in the 0.50-0.70 aw, range to maintain their desirable texture, chemical degradation is a strong candidate because reactions rates are at a maximum. In general, as water activity increases so do reaction rates, but lipid oxidation is unique in that the reaction rate also increases at very low water activity (1). Examples of reactions that can result in product degradation and end of shelf life include staling, Maillard browning (changes in color and flavor), lipid oxidation (rancidity), enzymatic (changes in texture, color, and flavor), and vitamin break down (nutritional quality loss). Since lowering water activity to slow reactions is not an option, as it would change the texture, instead, other interventions are typically warranted such as reformulation to remove reactants, inclusion of oxygen absorbers, or modified atmosphere packaging.
The largest category of baked snacks
contains products whose water activities are less than 0.70 aw, so microbial spoilage is not the most likely event that will end shelf-life. For products that need to be in the 0.50-0.70 aw, range to maintain their desirable texture, chemical degradation is a strong candidate because reactions rates are at a maximum. In general, as water activity increases so do reaction rates, but lipid oxidation is unique in that the reaction rate also increases at very low water activity (1). Examples of reactions that can result in product degradation and end of shelf life include staling, Maillard browning (changes in color and flavor), lipid oxidation (rancidity), enzymatic (changes in texture, color, and flavor), and vitamin break down (nutritional quality loss). Since lowering water activity to slow reactions is not an option, as it would change the texture, instead, other interventions are typically warranted such as reformulation to remove reactants, inclusion of oxygen absorbers, or modified atmosphere packaging.
Deep fried products such as potato chips pose a unique problem. The water activity of these products is quite low at less than 0.10 aw. The assumption may be that they should have extremely long shelf life since their water activity is so low. However, as mentioned earlier, the rate of lipid oxidation that leads to rancidity uniquely increase at very low water activity (Figure 3). Since these products contain high levels of lipids in the form of fat, they are very susceptible to oxidation. Consequently, these products are typically packed in a nitrogen flush to remove oxygen and have a limited shelf life. When changes in flavor or odor due to chemical reactions is what is ending shelf life, the time required for the reaction to have progressed to the point of unacceptability at a given water activity and temperature will be the product’s shelf life. If the rate constants for these reactions at several different storage conditions are determined, a predictive model can be used to estimate the time needed for the reaction to proceed to an unacceptable level under any storage conditions. To do this, the progress of the reaction will need to be tracked using some type of quantitative assessment. Examples of methods for quantifying common reactions include:
Lipid Oxidation/Rancidity
- Peroxide values
- Tbar values
- Oxygen consumption
- Sensory
Browning Reactions - Color changes
- Sensory
- Formation of reaction products
Vitamin Loss - Test kits (ELISA)
- HPLC
While there are examples of shelf life models in the literature, the only fundamental model that includes both water activity and temperature is hygrothermal time (2). It is derived from a form of the Eyring (3) equation for rate change and Gibbs equation for free energy and is given by
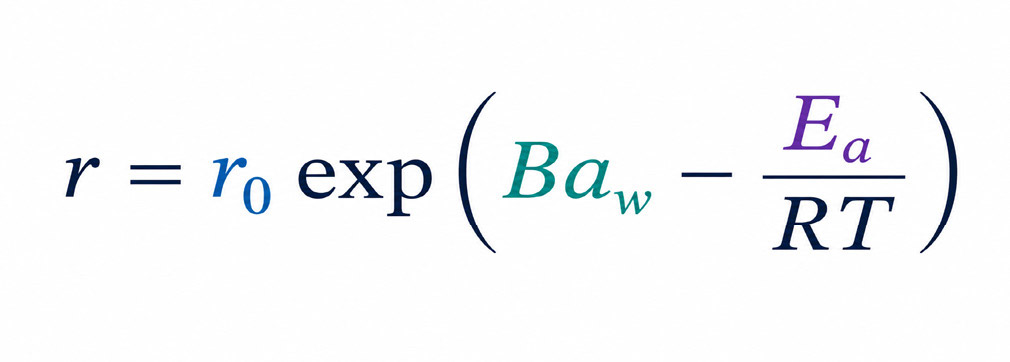
where T is the temperature (K), R is the gas constant (J mol-1 K-1), Ea is the activation energy (J mol-1), B is the molecular volume ratio, aw, is the water activity, and r0 is the rate at the standard state. In practice, the values for B, Ea/R and r0 will be unique to each situation and are derived empirically through least squares iteration. Once the constants are known, any temperature and water activity can be used with the hygrothermal time model to determine rate of oxidation at those conditions and hence the shelf life that the product will remain acceptable to the consumer.
WATER ACTIVITY AND MICROBIAL GROWTH
The actual organism that will proliferate at a given water activity varies with each organism having a lower water activity limit below which it will not grow. A list of the water activity lower limits for growth for common spoilage organisms can be found in Table 2 (4). These growth limits indicate that all pathogenic bacteria stop growing at water activities less than 0.87 while the growth of common spoilage
yeasts and molds stops at 0.70 aw, which is known as the practical limit. Only xe- rophilic and osmophylic organisms can grow below 0.70 aw, and all microbial growth stops at water activities less than 0.60. Other intrinsic factors such as pH impact microbial growth as well. Baked snacks in this range are not considered unsafe because the growth of molds and yeasts does not cause foodborne illness.
However, the growth of non-pathogenic organisms does typically render the product undesirable to a consumer and is considered to have ended the shelf life of the product. Consequently, the water activity must be reduced to below 0.70 E, or other interventions are needed to prevent mold growth.
| Microorganism | aw limit | Microorganism | aw limit |
| Clostridium botulinum E | 0.97 | Penicillum expansum | 0.83 |
| Pseudomonas fluorescens | 0.97 | Penicillum islandicum | 0.83 |
| Escherichia coli | 0.95 | Debarymoces hansenii | 0.83 |
| Clostridium perfringens | 0.95 | Aspergillus fumigatus | 0.82 |
| Salmonella spp. | 0.95 | Penicillum cyclopium | 0.81 |
| Clostridium botulinum A B | 0.94 | Saccharomyces bailii | 0.8 |
| Vibrio parahaemoliticus | 0.94 | Penicillum martensii | 0.79 |
| Bacillus cereus | 0.93 | Aspergillus niger | 0.77 |
| Rhizopus nigricans | 0.93 | Aspergillus ochraceous | 0.77 |
| Listeria monocytogenes | 0.92 | Aspergillus restrictus | 0.75 |
| Bacillus subtilis | 0.91 | Aspergillus candidus | 0.75 |
| Staphylococcus aureus (anaerobic) | 0.9 | Eurotium chevalieri | 0.71 |
| Saccharomyces cerevisiae | 0.9 | Eurotium amstelodami | 0.7 |
| Candida | 0.88 | Zygosaccharomyces rouxii | 0.62 |
| Staphylococcus aureus (aerobic) | 0.86 | Monascus bisporus | 0.61 |
Table 2. Water activity lower limits for growth for common spoilage organisms.
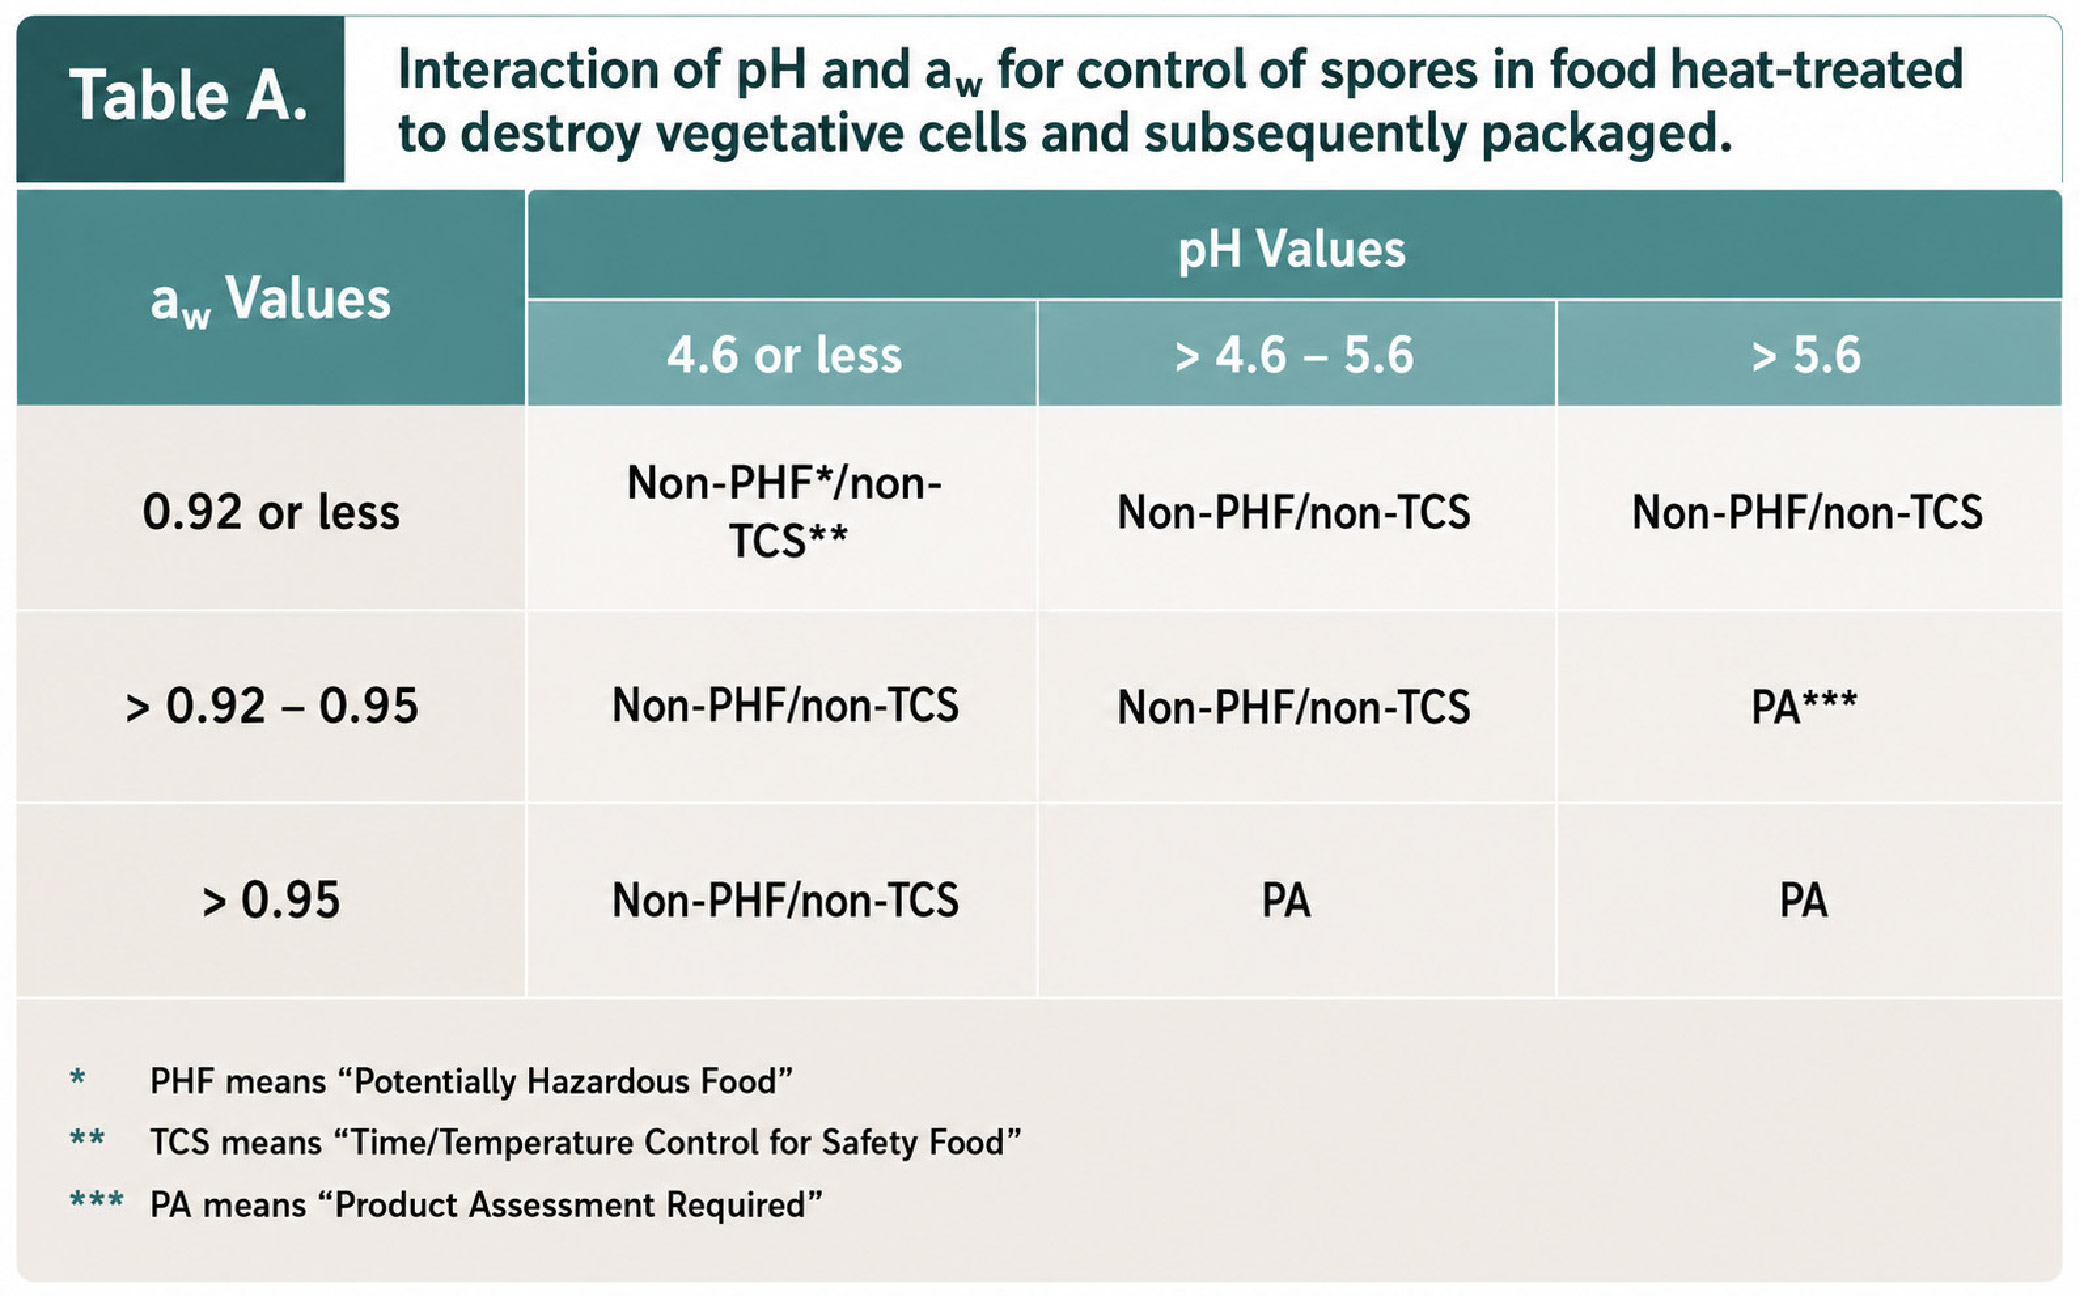
Baked snacks that need to be at water activities higher than 0.70 aw, to possess their desired soft texture will be susceptible to microbial spoilage. Fresh baked products will be at particularly high water activity levels, often above 0.90 aw. This would make them susceptible to spoilage by pathogenic bacteria. However, because they are baked at high temperatures that qualify them as heat-treated, they can be at water activities as high as 0.92 aw, and still considered shelf stable if they are placed in protective packaging (Figure 4). The most easily recognized product that fits in this category is bread, as its water activity will be high, but because it is baked at high temperatures, it is considered a sterile product while
in its packaging. However, once the package is opened and the bread is exposed to its surroundings, it will be susceptible to microbial growth with mold being
the most likely inoculant. Refrigeration after opening would slow down mold growth, but at the expense of speeding
THE MOST IMPORTANT SPECIFICATION
Most bakery products are sold on a weight basis, so maximizing the amount of water, the cheapest ingredient, that can be in a product while remaining safe and stable will maximize profitability. The information provided in this paper should show that each product has an ideal water activity range, and moving above or below this range will render the product undesirable. The key then to maximizing profitability while ensuring quality is to track water activity and end processing when the ideal water activity is achieved. This will avoid wasted energy from over drying and maximize the final moisture content and consequently, product revenue.

REFERENCES
- Bell, L. and Labuza, T. 1994. Influence of the low-moisture state on pH and its implication for reaction kinetics. Journal of Food Engineering 22:291-312.
- Carter, B. P., Syamaladevi, R. M., Galloway, M. T., Campbell, G. S., & Sablani, S. S. 2017. A Hygrothermal Time Model to Predict Shelf Life of Infant Formula. In U. Klinkesorn (Ed.), Proceedings for the 8th Shelf Life International Meeting (pp. 40–45). Bang- kok, Thailand: Kasetsart University.
- Eyring, H. 1936. Viscosity, plasticity, and diffusion as examples of absolute reaction rates. J. Chem. Phys. 4:283.
- Beuchat, L. 1983. Influence of water activity on growth, metabolic activities and survival of yeasts and molds. Journal of Food Protection 46(2):135-141.
Get in touch and learn more about your specific application and its possibilities! sales@novasina.ch
