
WATER ACTIVITY IN ANIMAL FEED
INTRODUCTION
The global feed industry is a cornerstone of modern animal agriculture, supplying nutritionally balanced feeds to support livestock, poultry, aquaculture, and companion animals across diverse production systems. Valued at hundreds of billions of dollars annually, the industry spans a complex supply chain that converts grains, oilseeds, forages, and by-products into safe, high quality feedstuffs tailored to regional species, production intensity, and regulatory requirements. Major multinational suppliers, such as Cargill, ADM, Bunge, Nutreco (SHV Group), Charoen Pokphand Group, Land O’Lakes/Purina, Alltech, and ForFarmers, play a dominant role, alongside countless regional mills and integrators. Together, these producers face growing pressure to deliver consistent feed quality while managing biological risks, sustainability goals, and global variability in raw materials, making feed safety and quality control central priorities across the industry.
Ensuring the safety and quality of feedstuffs is critical for animal health, performance, and regulatory compliance. Fresh feed is preferred for all livestock, but it cannot be stored for later use and cannot be shipped to other locations. Consequently, most feeds are dried and processed prior to storage or transport. However, these finished feeds can still be vulnerable to spoilage mechanisms such as mold growth, yeast activity, bacterial proliferation, and chemical degradation, all of which can lead to nutrient losses, mycotoxin formation, reduced shelf life, and economic losses. While moisture content has traditionally been used as a quality indicator for processed feed, it does not fully describe the biological and chemical risks associated with stored feeds. Water activity (aw) provides a more direct and reliable measure of feed safety and stability. Unlike moisture content, which quantifies the total water present, water activity describes the energy of water and directly influences microbial growth and chemical reactions. In feed production, most problems do not start when they become visible, but much earlier when water activity moves out of the safe range. Relying on moisture content alone is not sufficient, as products with the same moisture can behave very differently in terms of stability and risk.
Water activity gives you direct control over what really matters. It indicates whether mold can grow, whether mycotoxins can form, and whether your product will remain stable during storage and transport. By measuring water activity, feed producers can prevent mold growth and mycotoxin formation before they become a problem. At the same time, it allows precise control of the drying process, avoiding both under-drying, which leads to spoilage, and over-drying, which wastes energy and reduces yield. It also helps ensure consistent product quality despite variability in raw materials, and prevents physical issues such as clumping, softening, or loss of texture.
In addition, water activity supports better decisions in packaging by matching barrier performance to actual product needs, avoiding unnecessary costs. Without water activity, production remains reactive. With water activity, it becomes controlled and predictable. It connects safety, quality, and efficiency in one measurable parameter, making it one of the most effective tools to improve feed production performance. This paper outlines the role that water activity plays in feed safety and quality, highlights typical water activity ranges for common feedstuffs, and demonstrates how water activity measurement can complement traditional moisture testing to improve feed management decisions.
THEORY OF WATER ACTIVITY
Water activity is defined as the energy status of water in a system and is rooted in the fundamental laws of thermodynamics through Gibb’s free energy equation. It represents the relative chemical potential energy of water as dictated by the surface, colligative, and capillary interactions in a matrix. Practically, it is measured as the partial vapor pressure of water in a headspace that is at equilibrium with the sample, divided by the saturated vapor pressure of water at the same temperature. The water activity covers a range of 0 for bone dry conditions up to a water activity of 1.00 for pure water, resulting from the partial pressure and the saturated pressure being equal. Water activity is often referred to as the ‘free water’ and while useful when referring to higher energy, it is incorrect since ‘free’ is not scientifically defined and is interpreted differently depending on the context. As a result, the concept of free water can cause confusion between the physical binding of water, a quantitative measurement, and the chemical binding of water to lower energy, a qualitative measurement. Rather than a water activity of 0.50 indicating 50% free water, it more correctly indicates that the water in the product has 50% of the energy that pure water would have in the same situation. The lower the water activity then, the less the water in the system behaves like pure water.
While water activity is an intensive property that provides the energy of the water in a system, moisture content is an extensive property that determines the amount of moisture in a product. Water activity and moisture content, while related, are not the same measurement. Moisture content is typically determined through losson- drying as the difference in weight between a wet and dried sample. While useful as a measurement of purity and a standard of identity, as this paper will describe, moisture content does not correlate as well as water activity with microbial growth, chemical stability, or physical stability. Water activity and moisture content are related through the moisture sorption isotherm.
WATER ACTIVITY MEASUREMENT OF ANIMAL FEED
Water activity is measured by equilibrating the liquid phase water in the sample with the vapor phase water in the headspace of a closed chamber and measuring the Equilibrium Relative Humidity (ERH) in the headspace using a sensor. The relative humidity can be determined using a resistive electrolytic sensor, a chilled mirror sensor, or a capacitive hygroscopic polymer sensor. Instruments from Novasina, like the Labmaster NEO, utilize an electrolytic sensor to determine the ERH inside a sealed chamber containing the sample. Changes in ERH are tracked by changes in the electrical resistance of the electrolyte sensor. The advantage of this approach is that it is very stable and resistant to inaccurate readings due to contamination, a particular weakness of the chilled mirror sensor. Additionally, some feed formulations may contain volatile materials that can interfere with a chilled mirror sensor. These volatiles are overcome in Novasina instruments using protective filters that protect the sensor, making the resistive electrolytic sensor the most accurate and precise instrument with the lowest maintenance requirements capable of testing all types of feed products.
The water activity of feeds can cover a wide range depending on the type and post-harvest processing. Table 1 shows a range of water activity values for different feed products and indicates that some feed products can have similar water activities, but different moisture contents. Test times ranged from 5 minutes to 22 minutes depending on the product type. Feed samples do not typically contain volatiles that can interfere with the water activity values, so no filters were used. The hay cube and feed pellets were crushed before testing while the other samples were added to the testing cup with no special handling.
| Product | Water Activity | Moisture Content | Test Content |
| Grass Hay | 0.326 | 16.5 | 6.3 |
| Alfalfa Hay | 0.340 | 18.1 | 5.3 |
| Hay Cube | 0.484 | 9.6 | 12.0 |
| Bird Seed Mix | 0.498 | 10.2 | 15.7 |
| Chicken Protein Feed | 0.526 | 10.1 | 7.7 |
| Horse Feed Supplement | 0.547 | 12.4 | 9.7 |
| Dried Distillers Grain | 0.552 | 14.7 | 10.1 |
| Feed Pellets | 0.586 | 11.2 | 22.5 |
| Horse Feed Mix | 0.667 | 21.2 | 39.8 |
When testing the water activity of feed products, sample handling and presentation can play an important role
in achieving consistent and accurate readings. The key elements of achieving good results include:
- Use the same sampling procedure for a product each time it is tested
- Hard pelleted products are best tested crushed or ground to create a more homogeneous sample
- If samples contain multiple components such as mixed ration, include all the components in the testing sample
- Minimize the time the sample is exposed to the room humidity during preparation steps and storage prior to testing
WATER ACTIVITY AND MICROBIAL GROWTH IN FEED
The greatest potential risk presented by feed products is the potential for microbial contamination. Each microorganism maintains an optimal internal water activity, which is essential for normal metabolic function, growth, and reproduction. When exposed to an environment with a lower water activity than its cytoplasmic water activity, the cell experiences osmotic stress and begins to lose water to its surroundings, as water naturally moves from regions of higher water activity (energy) to lower water activity. This dehydration reduces turgor pressure and inhibits key metabolic processes. To continue growing, the microorganism must lower its internal water activity below that of the environment, primarily by accumulating compatible solutes to increase intracellular osmolarity. The capacity to adjust internal water activity varies among species, resulting in organism‑specific limiting water activity thresholds below which growth cannot occur (1, 2). Importantly, microbial growth depends not on the total amount of water present (moisture content), but on the energy state of the water, its water activity, and the microorganism’s ability to access and utilize that water.
A summary of the lower water‑activity limits for growth of common spoilage organisms is provided in Table 2. These limits show that pathogenic bacteria are unable to grow at water activities below 0.87 aw, whereas the growth of most spoilage yeasts and molds ceases at approximately 0.70 aw, often referred to as the practical limit. Only xerophilic and osmophilic organisms can grow at water activities below 0.70 aw, and no microbial growth has been observed at water activities less than 0.60. Microbial growth rates can also be modeled using water activity in combination with other intrinsic and extrinsic factors such as temperature and pH.
| Microorganism | aw limit |
| Clostridium botulinum E | 0.97 |
| Pseudomonas fluorescens | 0.95 |
| Clostridium perfringens | 0.95 |
| Salmonella spp. | 0.95 |
| Clostridium botulinum A B | 0.94 |
| Vibrio parahaemoliticus | 0.94 |
| Bacillus cereus | 0.93 |
| Rhizopus nigricans | 0.93 |
| Listeria monocytogenes | 0.92 |
| Bacillus subtilis | 0.91 |
| Staphylococcus aureus (anaerobic) | 0.9 |
| Saccharomyces cerevisiae | 0.9 |
| Candida | 0.88 |
| Staphylococcus aureus (aerobic) | 0.86 |
| Microorganism | aw limit |
| Penicillium expansum | 0.83 |
| Penicillium islandicum | 0.83 |
| Fusarium verticillioides | 0.88 |
| Aspergillus fumigatus | 0.82 |
| Penicillum cyclopium | 0.81 |
| Saccharomyces bailii | 0.8 |
| Penicillum martensii | 0.79 |
| Aspergillus niger | 0.77 |
| Aspergillus ochraceus | 0.77 |
| Aspergillus restrictus | 0.75 |
| Aspergillus candidus | 0.75 |
| Eurotium chevalieri | 0.71 |
| Eurotium amstelodami | 0.7 |
| Zygosaccharomyces rouxii | 0.62 |
| Monascus bisporus | 0.61 |
Mold growth is of particular concern for feed products because of the potential of ingestion of harmful spores or mycotoxins (3, 4). To prevent mold growth, the water activity must be reduced below 0.70 aw or alternative interventions—such as preservative systems or vacuum packaging—must be employed. Thankfully, a comparison of Table 2 and Table 3 indicates that even higher water activity levels are needed for toxin production than are needed for growth. A mold that is actively growing will only produce toxin when growth is established and the water activity levels are high enough. Toxin production can be viewed as a luxury that the mold utilizes to make it more competitive, but only when conditions are ideal and there are no other hurdles impeding its growth.
Table 3. A list of common mycotoxins found in animal feed, the organism that produces the toxin, where it is commonly found, its effect on animal health, and the minimum water activity level needed for production
(3,4,5).
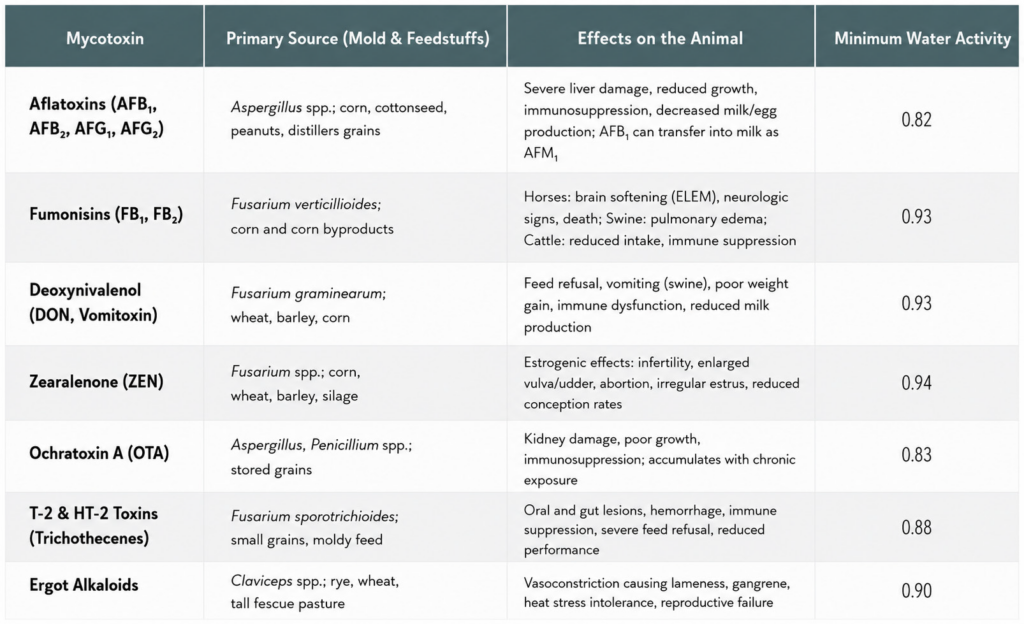
As shown in Table 1, the water activity levels of all feed products tested are well below the threshold required for mold growth, let alone mycotoxin production. Consequently, feed that is properly processed, dried, and stored is not typically a source of contamination. Problems arise when stored feed products are unknowingly exposed to high humidity or when water infiltrates the storage container. Such exposure can raise the water activity of the feed above the thresholds for both mold growth and toxin production, resulting in contaminated feed that may cause severe illness in animals that consume it.
CASE STUDY: IMPROPERLY STORED FEED CONTAMINATES BEEF CATTLE
A well‑documented case of mycotoxin‑related livestock illness occurred on a family‑owned farm in the southern United States, where a group of feeder steers developed progressive illness and multiple deaths after being fed mold‑contaminated stored corn (6, 7). The corn had been improperly dried and stored under warm, humid conditions following harvest, with significant insect damage to kernels, creating an ideal environment for growth of Aspergillus flavus. Although the feed did not appear severely moldy at first glance, laboratory analysis revealed aflatoxin concentrations of approximately 1,500 ng/g (1.5 ppm) in the corn, far exceeding safe feeding limits. Clinically, affected cattle showed poor growth, depression, reduced feed intake, coughing, and respiratory distress, and the herd responded poorly to antibiotic treatment. Necropsy and histopathological examination of dead animals revealed liver lesions characteristic of aflatoxicosis, including centrilobular hepatocellular vacuolation, and aflatoxin residues were detected in tissues. Once the contaminated stored feed was identified and removed, no additional deaths occurred.
Importantly, routine monitoring of the water activity (aw) of the stored corn would likely have provided an early warning that the feed was unsafe, as the readings would have indicated that there was the possibility of fungal growth and mycotoxin production even when visible spoilage is limited. This case clearly demonstrated that mycotoxins produced during feed storage, rather than in the field, can cause severe systemic disease and mortality in livestock, highlighting the critical importance of proper grain drying, storage, and the monitoring of objective indicators such as water activity to prevent mycotoxin exposure.
WATER ACTIVITY AND CHEMICAL STABILITY OF FEED
The water activity of intermediate‑moisture and dry feeds is typically below 0.70 aw, a level at which microbial growth is unlikely to occur. However, products within this range do not possess unlimited shelf life. Instead, other failure modes become dominant. For feeds with water activities between 0.40 and 0.70 aw, chemical degradation is a primary concern because many reaction rates reach their maximum within this interval. Chemical processes such as Maillard browning, lipid oxidation, and enzymatic reactions can negatively affect the flavor, appearance, and nutritional value of the product. Water activity influences these reactions by reducing activation energy, increasing molecular mobility, and thereby increasing the reaction rate constant. Consequently, reaction rates correlate more strongly with water activity than with moisture content. In general, increasing water activity accelerates most chemical reactions, although the specific relationship depends on both the product matrix and the reaction mechanism (Figure 2). Most reactions reach peak rates at approximately 0.70–0.80 aw, where further increases in water act as a diluent. Lipid oxidation is a notable exception, as its rate increases under low‑water‑activity conditions. Vitamin degradation and rancidity are the reactions most likely to impact the quality and shelf life of feeds. Vitamin and mineral loss most often occurs due to hydrolysis reactions where the vitamins are transformed into compounds that cannot be utilized by the animals. Vitamin loss can be mitigated by drying to and maintaining lower water activity levels where the reaction rate is slow enough to prevent substantial loss in nutrient quality prior to consumption.
Rancidity occurs when lipids are oxidized through a complex process that involves multiple pathways and requires the presence of lipids, oxygen, and free radicals. As a result, lipid oxidation is typically mitigated by limiting oxygen exposure, most often through nitrogen flushing or the incorporation of oxygen absorbers. Rancidity develops when lipid oxidation produces volatile compounds that impart musty or off‑odors and flavors. Dry feeds are particularly vulnerable because they are frequently coated with a surface fat layer to enhance palatability and nutritional value. Once rancidity occurs, pets may refuse the food, or owners may discard it due to the objectionable odor. As noted previously, lipid oxidation is unique among degradation reactions in that its rate increases not only with rising water activity but also under low‑water‑activity conditions. This behavior makes the general assumption that “lower water activity is always better” inapplicable for lipid stability.
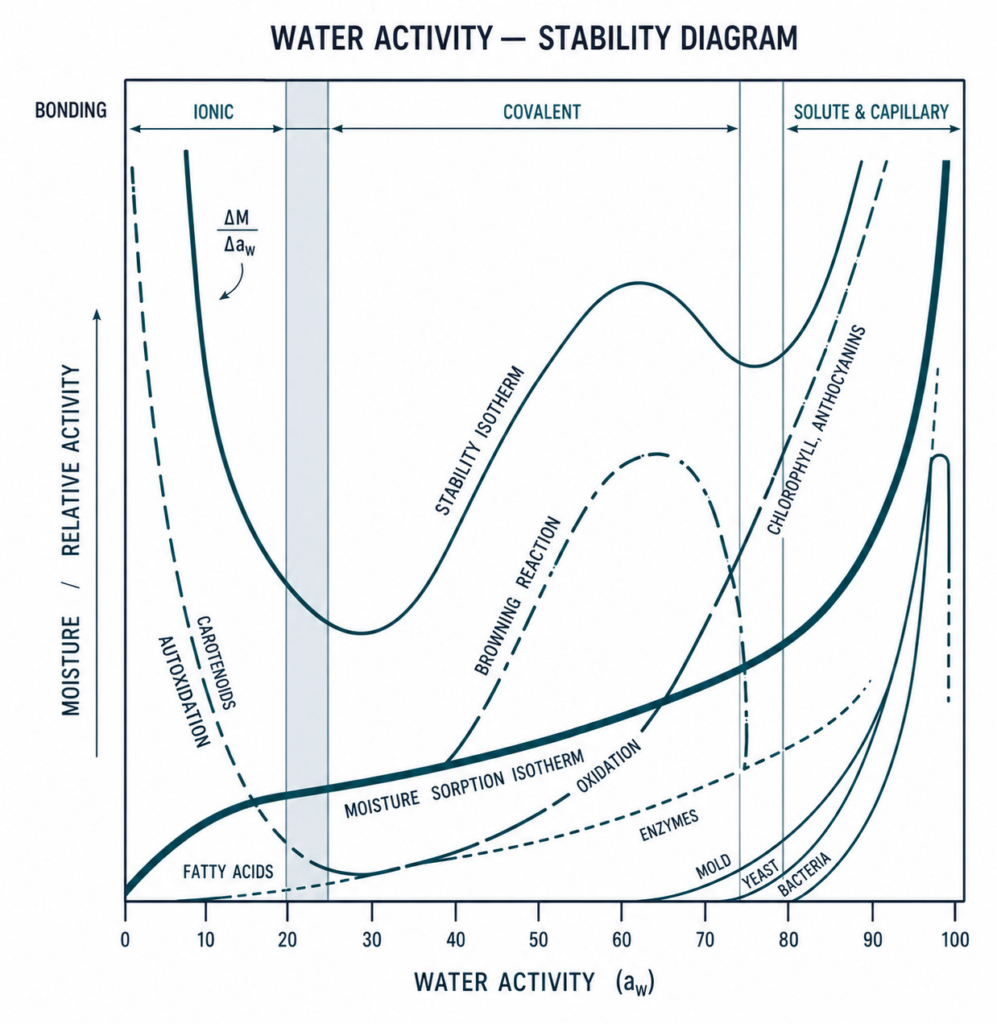
activity (by permission Ted Labuza).
WATER ACTIVITY AND PHYSICAL STABILITY OF FEED
Physical stability is a key determinant of shelf life for low-water-activity (0.20–0.50 aw) feeds such as dry pellets or cubes. These products are densified to make them easier to handle, store and transport. In this range, chemical reactions and microbial growth are generally not the primary failure modes. Nevertheless, these products still experience quality loss over time, most commonly due to changes in texture or becoming sticky. Water activity affects both the structural and mechanical properties of feed matrices, and each product type has a specific range in which its texture remains stable.
To achieve maximum shelf life, feed products must be manufactured within their optimal water activity range and must maintain that level throughout distribution and storage. Low water activity is associated with a hard, dry texture. When water activity rises above the desired range, the pellets and cubes absorb moisture, soften, and become sticky, causing products to clump and are hard to handle and move through piping. Maintaining the appropriate water activity range is therefore essential for preserving product quality and optimal handling of feeds.
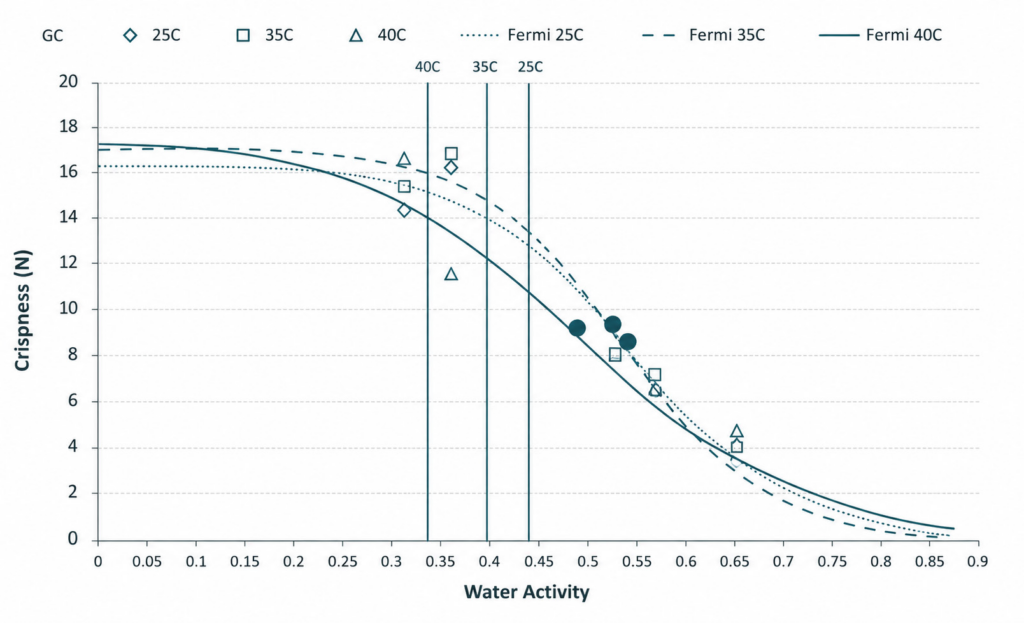
Investigations have shown documented changes in crispiness when equilibrating dry products to various water activity values. (8, 9). Using texture profile instrumentation, a relationship between crispness and water activity can be characterized, allowing identification of a water activity range where texture changed from acceptable to unacceptable. In general, dry products will maintain their texture until they move beyond the critical water activity where a sigmoidal loss in texture will occur (Figure 2).
One mechanism by which the water activity of dry feed can change over time is moisture migration. Within a package, water will transfer between individual particles whenever differences in water activity exist—regardless of differences in total moisture content. This occurs because water moves from regions of higher water activity (higher energy state) to regions of lower water activity, rather than simply from areas of higher to lower moisture concentration.
When individual seed or grain components with differing water activity levels are combined, moisture migration continues until equilibrium is achieved. This redistribution can lead to undesirable textural changes in each component, such as softening or loss of hardness. To prevent these effects, all components should be formulated and processed to reach the same water activity prior to blending. If components with different initial water activities must be combined, predictive moisture migration models can be used to estimate the final equilibrium water activity and anticipate resulting texture changes.
Another mechanism by which water activity—and consequently product texture—can change is exposure to elevated ambient humidity. As described in the theory section, water activity corresponds to a product’s equilibrium relative humidity (ERH) and is therefore directly influenced by environmental humidity. For example, a product with a water activity of 0.40 aw placed in an environment with 60% relative humidity will absorb moisture until its internal water activity equilibrates at approximately 0.60 aw. Although this process occurs gradually, insufficient moisture barriers can allow the water activity to rise beyond its optimal range, resulting in softening, loss of desired texture, and, at relative humidities above approximately 70%, increased risk of mold growth.
PACKAGING SELECTION
Moisture‑barrier packaging slows moisture transfer by limiting the rate of water vapor ingress. When choosing packaging materials, the goal is to provide adequate protection without overspending on unnecessarily high‑barrier materials, which can lead to avoidable financial waste. Modeling tools are available to help determine the ideal water vapor transmission rate (WVTR) required to maintain product quality based on the target water activity range and expected storage conditions. In many cases, users discover they are using packaging with a WVTR of 0.8 g/m²·day when a less expensive material with a WVTR of 1.0 g/m²·day would perform just as well. Contact Novasina to learn more about using water activity data to optimize packaging selection and reduce costs.
INGREDIENT INSPECTION
Once an ideal water activity specification has been established to minimize microbial, chemical, and physical degradation, the next challenge is to consistently manufacture product at that target level. In principle, production parameters such as oven temperature, extruder settings, and belt speed could be fixed from run to run, yielding product with uniform water activity. In practice, however, external factors require continual adjustment of these settings. Variability in incoming ingredient properties—particularly moisture content and water activity—as well as fluctuations in the production environment can alter drying behavior. When process settings are calibrated based on an assumed water activity of raw materials, any deviation from that assumption will result in finished product with inconsistent water activity. Typically, this discrepancy is not detected until the first batch completes processing and undergoes quality‑assurance testing. At that point, if the product fails to meet specification, it must be reworked or discarded, resulting in inefficiency and waste. An effective strategy to reduce problems caused by variability in incoming ingredients is to monitor their water activity and establish an acceptable range that ensures finished product meets specification with minimal process adjustment. This can be readily achieved by collecting a subsample of each incoming ingredient lot and measuring its water activity. If the measured value falls outside the acceptable range, the ingredient can either be rejected or used with predefined adjustments to processing conditions, knowing that standard settings will not produce the desired result. The use of water activity testing as an incoming‑ingredient screening tool is another powerful application for water activity and incorporating this practice could provide an additional level of process control and help reduce rework, variability, and waste.
WATER ACTIVITY: THE MOST IMPORTANT SPECIFICATION FOR FEED
For feeds, establishing an ideal water activity specification is a critical step in processing and storing products for both safety and quality. This specification helps prevent microbial proliferation, reduce undesirable chemical reactions, minimize physical and structural degradation, and limit moisture migration during storage. The optimal water activity target depends on the most likely mode of failure for a given product type, such as texture loss in dry pellets, chemical degradation in nutritional supplements, or microbial growth in wet feeds. Once this target value is identified, a combination of storage strategies and processing controls can be used to consistently achieve and maintain the desired water activity. In addition, the careful monitoring of the water activity of product on the production line will eliminate unnecessary energy waste and weight loss due to processing to lower than ideal water activities, which will maximize revenue. Finally, feed products should be stored in packaging that possesses adequate moisture barrier properties to slow water activity change over time. In summary, feed manufacturers should:
- Establish an ideal water activity specification
- Process to meet that specification
- Monitor production with frequent water activity testing to ensure specifications are met
- Package product in quality moisture barrier packaging
- Monitor stored product over time for changes in water activity
This will ensure a safe, quality product with an optimal shelf life and maximum revenue. In short, water activity is the most important feed specification.

REFERENCES
- Beuchat, L. 1983. Influence of water activity on growth, metabolic activities and survival of yeasts and
molds. Journal of Food Protection 46(2):135-141.
- Scott, W. 1957. Water relations of food spoilage microorganisms. Advances in Food Research 7:83-127.
- Mostrom, M. 2021. Overview of mycotoxicosis in animals. MSD Manual. Overview of Mycotoxicoses in
Animals – Toxicology – MSD Veterinary Manual
- Muñoz-Solano, B., Lizarraga Pérez, E., González-Peñas, E. Monitoring Mycotoxin Exposure in Food-
Producing Animals (Cattle, Pig, Poultry, and Sheep). Toxins 2024, 16, 218. https://doi.org/10.3390/toxins16050218
- Stein, R.A., Bulboacӑ, A.E. Chapter 21 – Mycotoxins, Editor(s): Christine E.R. Dodd, Tim Aldsworth, Richard
A. Stein, Dean O. Cliver, Hans P. Riemann, In Foodborne Diseases (Third Edition), Academic Press, 2017,
Pages 407-446, https://doi.org/10.1016/B978-0-12-385007-2.00021-8
- Colvin, B.M., Harrison, L.R., Gosser, H.S., and Hall, R.F. 1984. Aflatoxicosis in feeder cattle. JAVMA 184: 956-958.
- Clark, Kim. 2026. Aflatoxin in Corn. Nebraska Dairy Extension. Aflatoxin in Corn | Nebraska Dairy Extension | Nebraska.
- Katz, E.E. and Labuza, T.P. 1981. Effect of water activity on the sensory crispness and mechanical
deformation of snack food products. Journal of Food Science 46, 403.
- Carter, B.P., Galloway, M.T., Campbell, G.S., and Carter, A.H. 2015. The critical water activity from dynamic dewpoint isotherms as an indicator of crispness in low moisture cookies. Journal of Food Measurement and Characterization 9(3):463-470.
Get in touch and learn more about your specific application and its possibilities! sales@novasina.ch
